
Geography
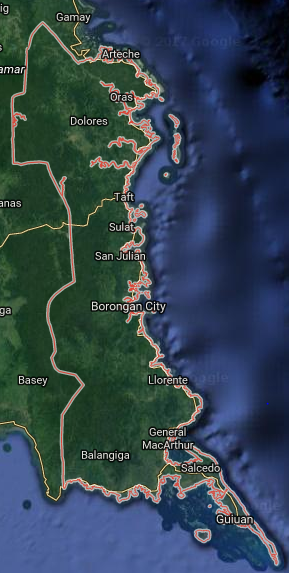
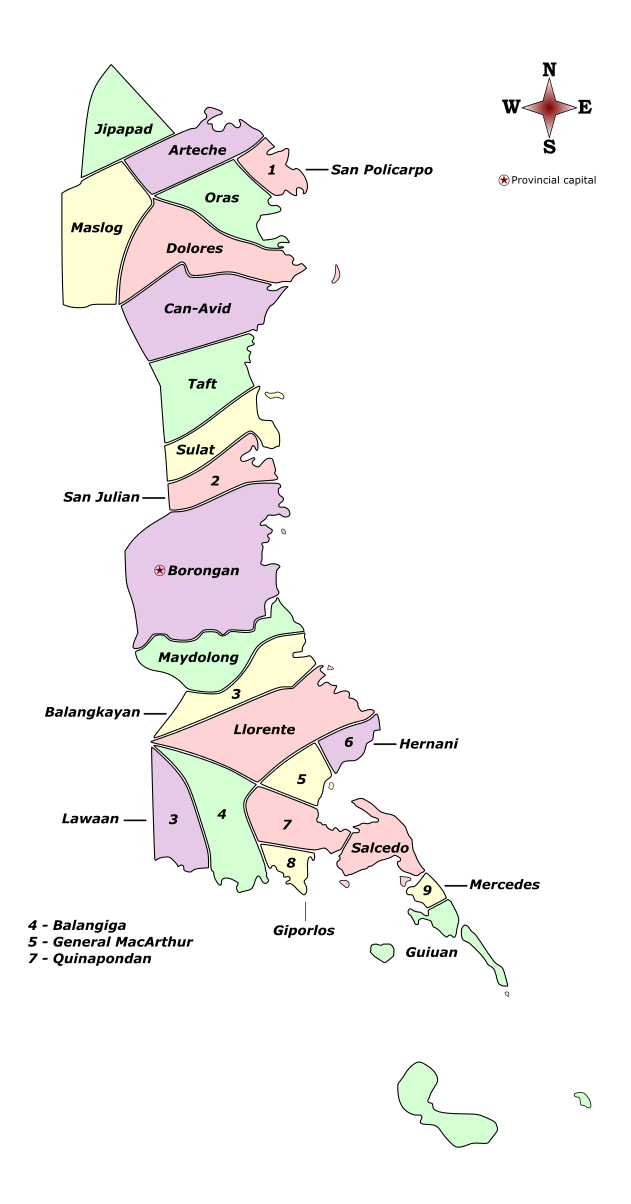
Catbalogan is a coastal component city in the province of Samar. It serves as the provincial capital.
The city has a land area of 274.22 square kilometers or 105.88 square miles which constitutes 4.53% of Samar’s total area. Its population as determined by the 2020 Census was 106,440. This represented 13.42% of the total population of Samar province, or 2.34% of the overall population of the Eastern Visayas region. Based on these figures, the population density is computed at 388 inhabitants per square kilometer or 1,005 inhabitants per square mile.
Administrative divisions
Catbalogan has 57 barangays as shown in the following table.
| Barangays | Population | Change (2015-2020) | Density Brgy. |
|||
| % (2020) | 2020 | 2025 | ||||
| Albalate | 0.28% | 293 | 267 | 9.74% | 1.98% | |
| Bagongon | 0.66% | 707 | 696 | 1.58% | 0.33% | |
| Bangon | 0.26% | 272 | 245 | 11.02% | 2.22% | |
| Basiao | 0.66% | 700 | 648 | 8.02% | 1.64% | |
| Buluan | 0.74% | 791 | 763 | 3.67% | 0.76% | |
| Bunuanan | 4.50% | 4,786 | 4,358 | 9.82% | 1.99% | |
| Cabugawan | 0.91% | 964 | 956 | 0.84% | 0.18% | |
| Cagudalo | 0.26% | 275 | 185 | 48.65% | 8.70% | |
| Cagusipan | 0.22% | 231 | 210 | 10.00% | 2.03% | |
| Cagutian | 0.22% | 235 | 276 | -14.86% | -3.33% | |
| Cagutsan | 1.14% | 1,215 | 1,291 | -5.89% | -1.27% | |
| Canhawan Gote | 0.29% | 307 | 357 | -14.01% | -3.13% | |
| Canlapwas | 11.09% | 11,805 | 12,321 | -4.19% | -0.90% | |
| Cawayan | 0.16% | 165 | 177 | -6.78% | -1.47% | |
| Cinco | 0.81% | 865 | 836 | 3.47% | 0.72% | |
| Darahuway Daco | 0.65% | 810 | 760 | 6.58% | 1.35% | |
| Darahuway Gote | 0.65% | 689 | 633 | 8.85% | 1.80% | |
| Estaka | 1.08% | 1,148 | 1,067 | 7.59% | 1.55% | |
| Guindaponan | 3.38% | 3,597 | 3,325 | 8.18% | 1.67% | |
| Guinsorongan | 4.00% | 4,255 | 4,538 | -6.24% | -1.35% | |
| Ibol | 0.51% | 541 | 507 | 6.71% | 1.38% | |
| Iguid | 1.59% | 1,697 | 1,754 | -3.25% | -0.69% | |
| Lagundi | 0.96% | 1,023 | 828 | 23.55% | 4.55% | |
| Libas | 0.31% | 325 | 372 | -12.63% | -2.80% | |
| Lobo | 0.17% | 186 | 167 | 11.38% | 2.29% | |
| Manguehay | 0.13% | 135 | 188 | -28.19% | -6.73% | |
| Maulong | 5.59% | 5,954 | 5,699 | 4.47% | 0.93% | |
| Mercedes | 11.54% | 12,281 | 9,716 | 26.40% | 5.05% | |
| Mombon | 0.81% | 861 | 784 | 9.82% | 1.99% | |
| Muñoz | 1.61% | 1,712 | 2,736 | -37.43% | -9.40% | |
| New Mahayag | 1.31% | 1,393 | 1,195 | 16.57% | 3.28% | |
| Old Mahayag | 1.35% | 1,434 | 1,388 | 3.31% | 0.69% | |
| Palanyogon | 0.30% | 320 | 294 | 8.84% | 1.80% | |
| Pangdan | 3.13% | 3,334 | 2,919 | 14.22% | 2.84% | |
| Payao | 1.97% | 2,093 | 1,796 | 16.54% | 3.27% | |
| Poblacion 1 | 1.16% | 1,238 | 1,350 | -8.30% | -1.81% | |
| Poblacion 10 | 1.73% | 1,838 | 2,061 | -10.82% | -2.38% | |
| Poblacion 11 | 0.96% | 1,027 | 1,178 | -12.82% | -2.85% | |
| Poblacion 12 | 0.58% | 620 | 740 | -16.22% | -3.66% | |
| Poblacion 13 | 4.01% | 4,266 | 4,758 | -10.34% | -2.27% | |
| Poblacion 2 | 0.75% | 799 | 581 | 37.52% | 6.94% | |
| Poblacion 3 | 2.91% | 3,102 | 3,096 | 0.19% | 0.04% | |
| Poblacion 4 | 0.98% | 1,038 | 1,216 | -14.64% | -3.28% | |
| Poblacion 5 | 0.50% | 537 | 602 | -10.80% | -2.38% | |
| Poblacion 6 | 1.26% | 1,344 | 1,769 | -24.02% | -5.62% | |
| Poblacion 7 | 1.29% | 1,368 | 1,397 | -2.08% | -0.44% | |
| Poblacion 8 | 1.10% | 1,169 | 1,162 | 0.60% | 0.13% | |
| Poblacion 9 | 2.81% | 2,988 | 2,761 | 8.22% | 1.68% | |
| Pupua | 1.50% | 1,594 | 1,518 | 5.01% | 1.03% | |
| Rama | 1.58% | 1,683 | 1,640 | 2.62% | 0.55% | |
| San Andres | 5.54% | 5,898 | 5,184 | 13.77% | 2.75% | |
| San Pablo | 1.14% | 1,209 | 1,531 | -21.03% | -4.85% | |
| San Roque | 1.37% | 1,454 | 1,413 | 2.90% | 0.60% | |
| San Vicente | 0.88% | 936 | 943 | -0.74% | -0.16% | |
| Silanga | 2.79% | 2,974 | 2,934 | 1.36% | 0.29% | |
| Socorro | 1.67% | 1,773 | 1,584 | 11.93% | 2.40% | |
| Totoringon | 0.17% | 186 | 209 | -11.00% | -2.42% | |
| Total | 106,440 | 103, 879 | 42.47% | 0.51% | ||